StructReport.com
Market Structure Stability Disclosure Service
Markets continuously redistribute participation. This page records how participation breadth and concentration evolve across time.
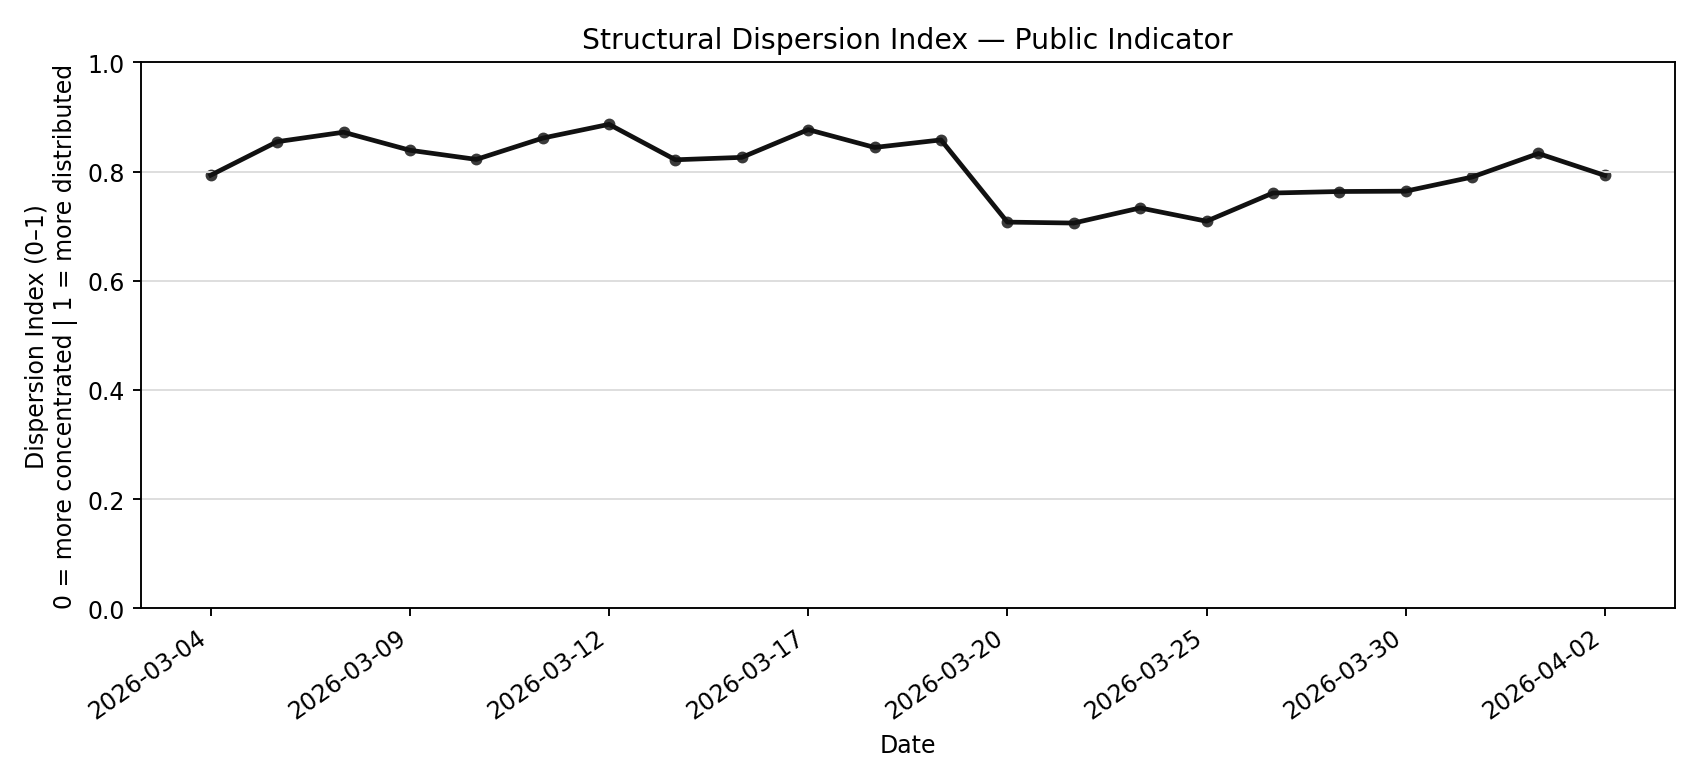
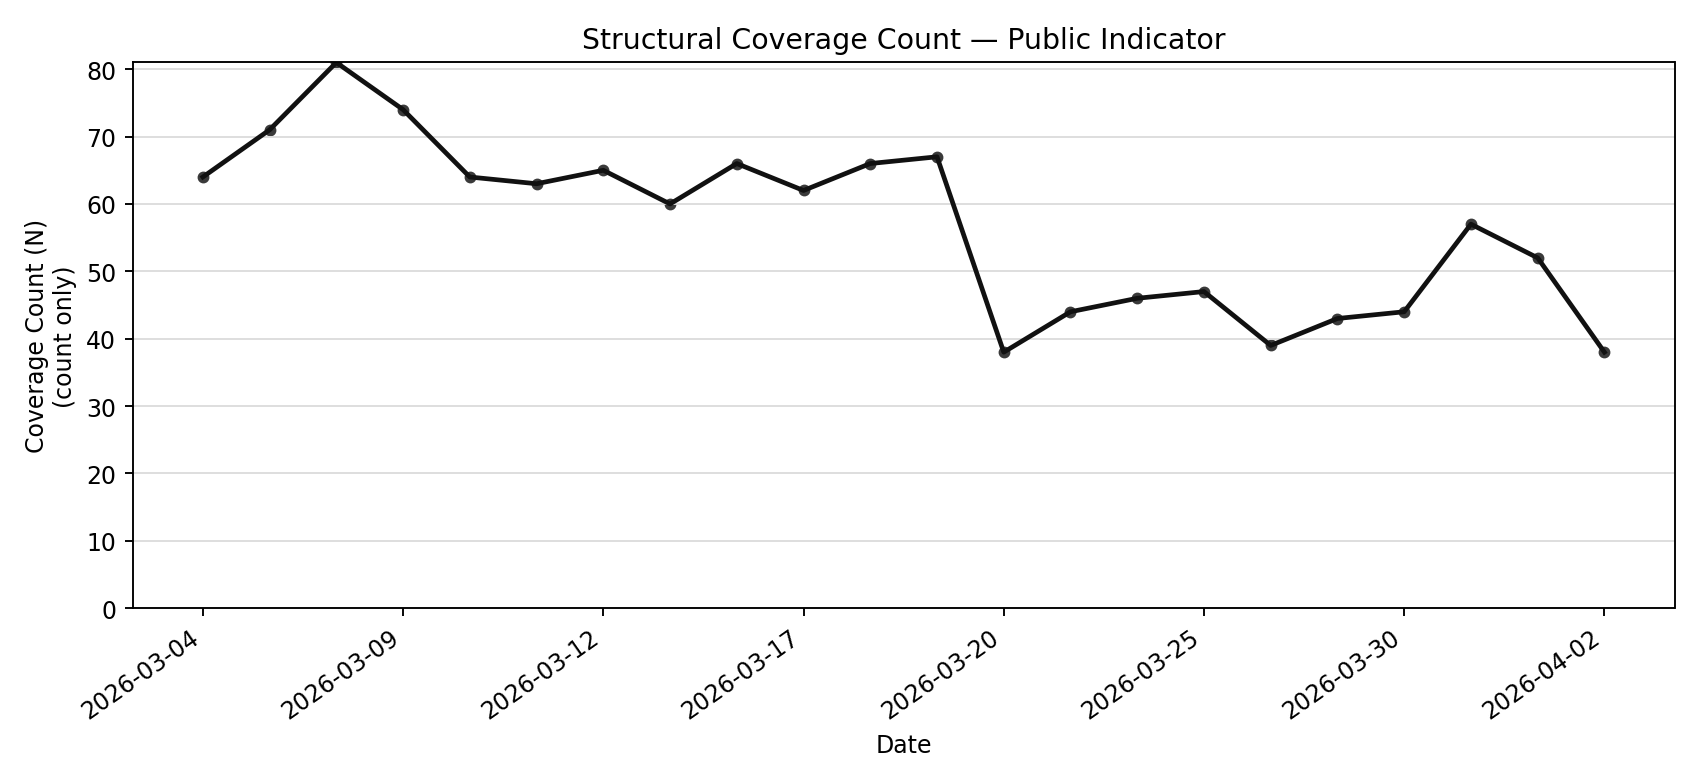
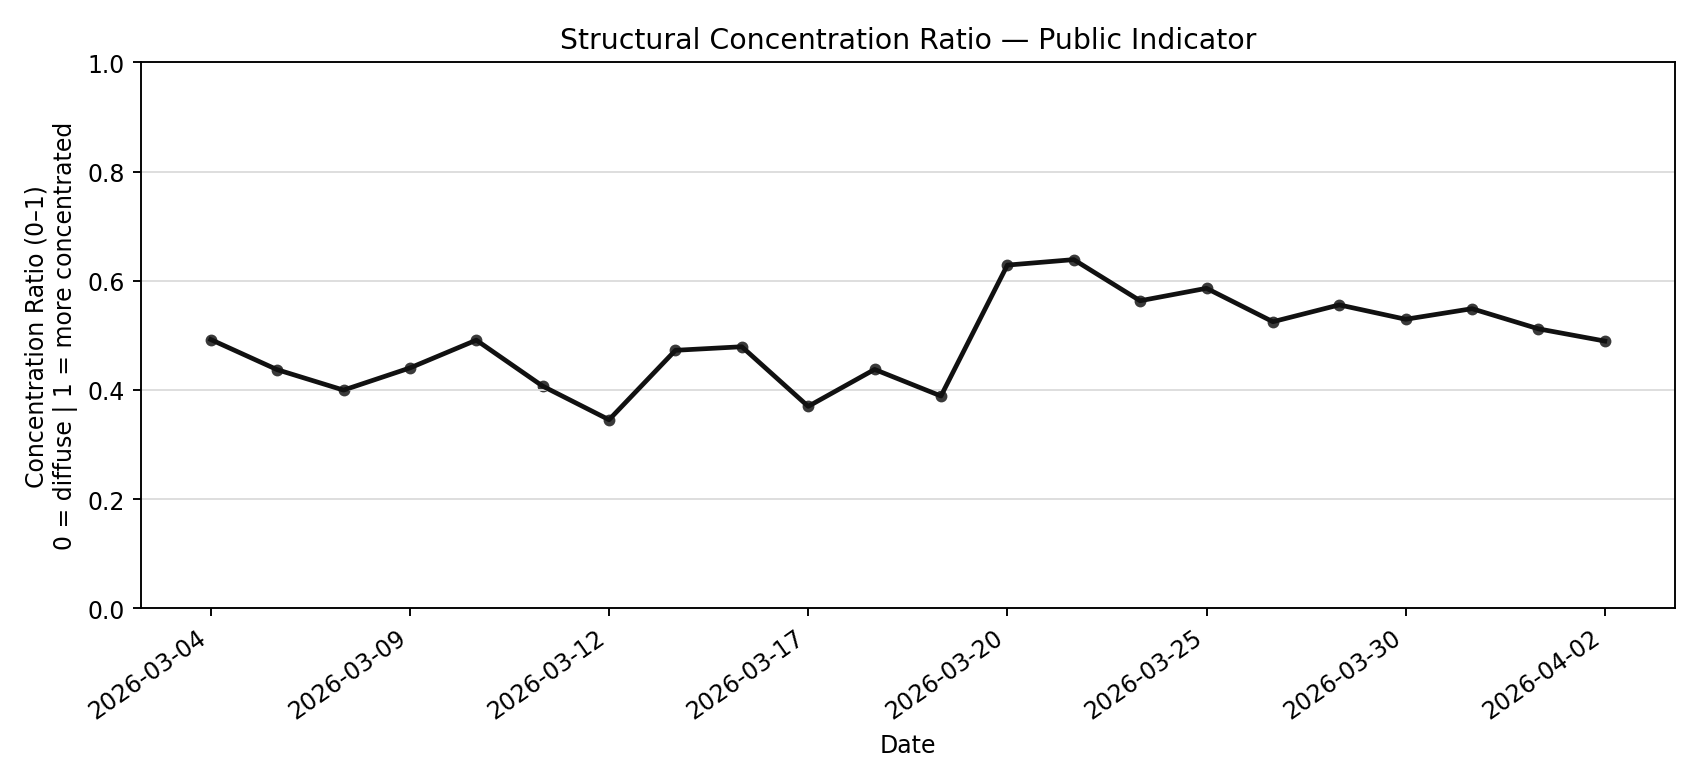
The panels below display three aggregated regime indicators derived from cross-sectional distribution measurements. They describe structural characteristics only and do not provide trading signals, execution guidance, position sizing, or forward return projections.
This page publishes aggregated distribution indicators only. No constituent identifiers, rankings, individual values, scoring methodology, or parameter definitions are disclosed.
This publication provides recorded measurements describing observable participation structure within a defined sampling window. It does not predict market direction, evaluate market quality, estimate expected returns, or classify conditions as favorable or unfavorable. All outputs are measurement records only.
The system reports persistence, dispersion, turnover, and continuity of participation. Any interpretation of meaning — including safety, risk, opportunity, or timing — depends entirely on user-defined rules external to this service.
Why This Exists
Some users operate independent decision frameworks that require consistent external structural measurements. This service provides one possible measurement source describing participation continuity across time.
The system itself does not improve decisions, reduce risk, or prevent loss. Usage and interpretation remain entirely external.
What The Service Provides
Reports disclose coverage, churn, dispersion, concentration, and continuity metrics aligned to a defined sampling window. No good/bad classification is provided.
- Recorded persistence of structural membership
- Expansion or contraction of participation breadth
- Entry and exit continuity relative to the measured set
- Statistical structural change detection (no causal inference)
Methodology
A multi-stage measurement pipeline produces stable observations across parameters and time windows. The objective is measurement consistency rather than market evaluation.
- Continuity-based universe filtering
- Cross-parameter persistence detection
- Multi-window robustness validation
- Recording coverage and churn metrics
- Automated report generation
What This Service Is Not
- Not investment advice
- Not trading signals
- Not predictions
- Not a recommendation list
- Not a risk rating
Contact
For report access requests or institutional communication:
Website: StructReport.com
Responses are handled manually. This service does not provide trading advice or customized recommendations.